Sometimes a particular song will get stuck in my head. It will play in my head over and over on loop until I get so annoyed that I put on other music just to get rid of it. Other times it will be a funny way someone pronounced a word, or an awkward moment from last week.
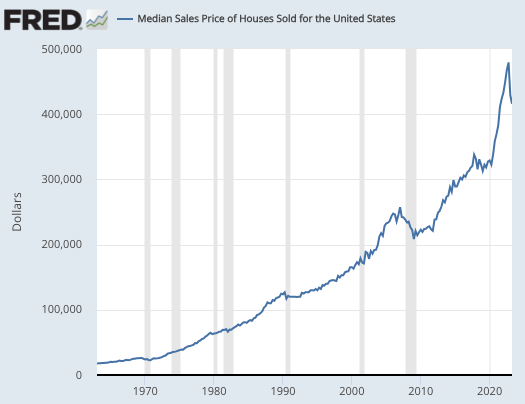
But lately, I’ve had a graph stuck in my head. I know that must sound a bit strange, but if you’re at all involved in real estate, I think you’ll understand when I show it to you. Here it is:

This graph shows the ratio between home prices and median income. All other things held equal, it is a pretty good indicator of the affordability of housing.
We are at a 70 year high. Housing has NEVER been as expensive as it is relative to median income going all the way back to the early 1950s.
The second highest peak on the graph was the 2008 real estate bubble, which ended with the largest drop in real estate prices in the last 70 years. If past drops are any indication, we are in for a hell of a real estate crash in the next couple of years.
However, there’s one large factor the graph above doesn’t take into account, which has a significant impact on housing prices — interest rates.
How affordable is housing really?
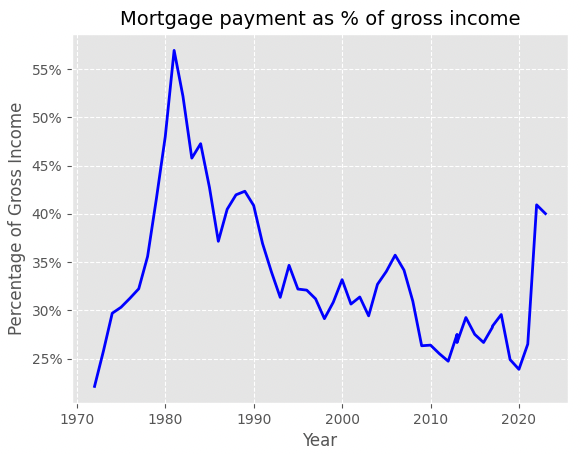
Let’s see what happens when we add interest rates to the equation and try to estimate what percentage of the median household’s gross income is required to pay a monthly mortgage.
Data sources: median income, mortgage rates, home prices
The graph above looks almost nothing like the price/median income chart. That’s because falling interest rates have largely masked the increase in median home price since the 1980s when interest rates reached 20%.
US Fed Funds Rates
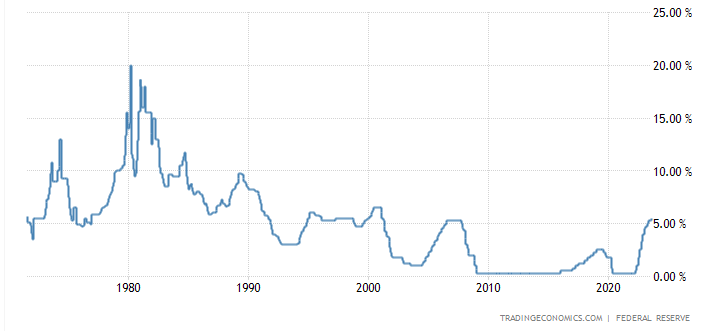
But this era may finally be coming to an end. Interest rates were near-zero for almost a decade following the 2008 financial crisis. The only place for them to go was up.
And that’s exactly what happened in the years following the COVID pandemic. To deal with the huge spike in inflation caused by money printing during 2020 and 2021, the Federal Reserve raised interest rates to a 20-year high. Combined with a noticeable drawdown in the M2 money caused by the Federal Reserve selling off assets from its balance sheet, this has led to the largest drop in median home prices since 2008.
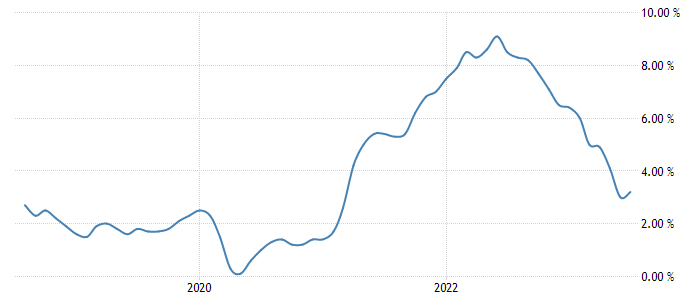
Thankfully inflation has fallen substantially. The last report from July of 2023 showed 3.3% inflation in consumer prices, down from a peak of 9.1% inflation in June of 2022.
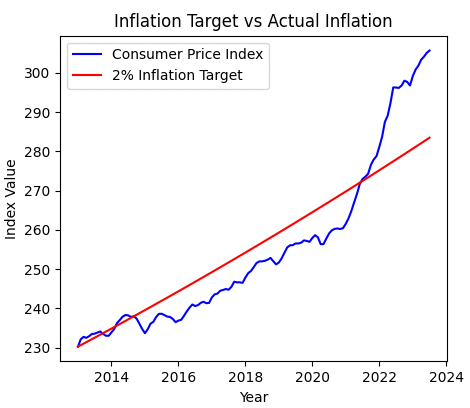
But there’s still a slight problem — the Federal Reserve doesn’t just want inflation at 2%. They want average inflation to be 2% over some longer time period. This is a policy termed “inflation targeting,” and it has been the official policy of the Federal Reserve since 2012. If the Federal Reserve really wants to stick to its long term inflation target, we’ll need several years of inflation below 2% to get there.
It’s possible that keeping interest rates at 5.5% for a couple of years will be sufficient for this goal. But if inflation is too sticky, the federal reserve may have to increase interest rates a bit further, or sell off more assets from their balance sheet. Neither one would be particularly good for property prices.
Population is not growing like it used to
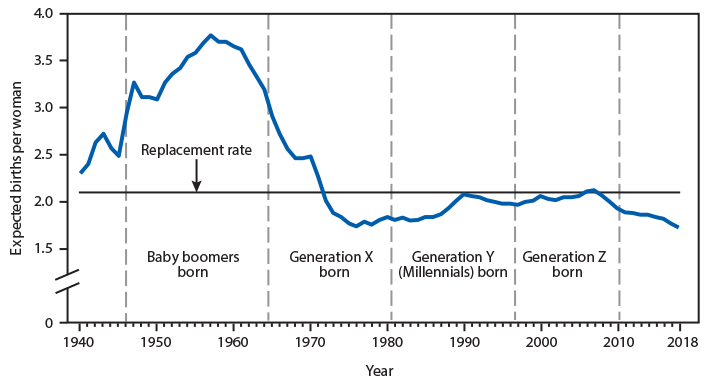
Population growth in the United States has been a long-running tailwind driving up property prices. The more people there are, the more land people need to live and work on. But in the last 15 years, developed countries all around the world have seen a dramatic decrease in the number of children per woman. Immigration, traditionally a strong suit of the United States, has not risen to compensate for those losses. As a result, we’ve seen a noticeable drop in population growth — a bad sign for the long term prospects for property ownership.
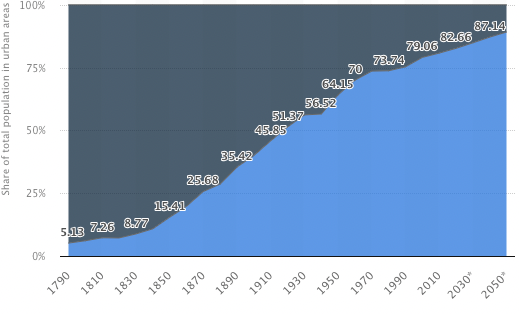
Urbanization is winding down
Another long-running tailwind that is winding down is the trend of urbanization. Americans have been moving to cities in droves for the last few hundred years. But a large majority of people already live in cities, meaning the rate of urbanization can’t continue at the same rate it has in the past. Owning land in an urban area is no longer as sure of a bet as it used to be.
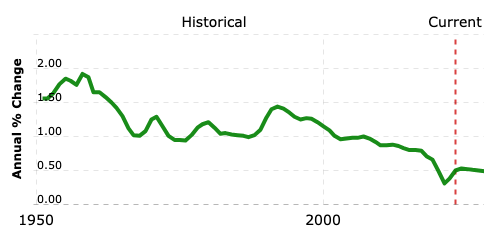
Lack of housing supply is slowly getting fixed
In the aftermath of the 2008 financial crisis, almost no new housing was built for several years.
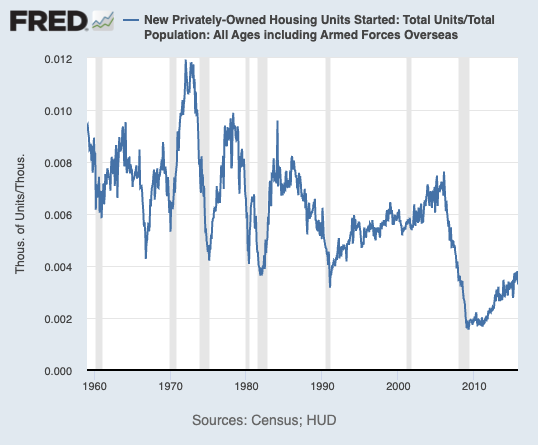
This has artificially buoyed home prices, particularly in large coastal cities like New York and San Francisco. But the tide is slowly turning against the “never build anything ever” movement, as can be seen in the graph above. If this upwards trend continues, we’re going to see much more supply in the places people want to live, which will naturally lower prices relative to what they would otherwise be.
If you own property, now is a decent time to sell
Given how far off we are from the Federal Reserve’s long term 2% inflation target, we could see continued declines in asset prices as they keep interest rates high and continue to sell off assets.
But even if property prices don’t continue to drop, owners face a decade of stagnation in property prices ahead. Increased housing supply, decreasing population growth, decreasing urbanization rates, and all-time high property prices are all headwinds that are going to result in very slow rates of property price growth.
On the flip side, investments outside of real estate have rarely looked so attractive. You can earn 5.25% on your cash with a normal FDIC insured savings account right now. Other investments look even more attractive.
This isn’t to say that there are no properties that could possibly be a good investment. But it’s going to be much harder to justify holding on to one over the coming years than it would have been over the last ten years.
If you’re interested in selling your property, send us an email at [email protected].


